
The Yield tracker area is the main reporting function for all poured and sold data and allows robust reporting on beer platform performance. Depending on the specific inquiry, the tracker shows poured/sold data by brand or date including, product loss/gain and the % yield calculation. There are many ways to slice and dice the data by clicking in the row or using the various functionality within the filter.
Yield Tracker Views
There are several different views within the yield tracker that provide different drilled down levels for managing your draft beer business. Each view provides a corresponding graphical form. Yellow represents pour data from the flow meters, Blue represents imported sold data from the POS. The setting wheel, located on the top of each view, allows for further customization such as day parts and other filters.
Monthly View
- The Month view provides a summation of all flow and sold data over a calendar month. This is the best view to see how your variances are trending month to month.
- To access this view, use the filter tool and select any date range greater than 30 days.
Weekly View
- The weekly view provides a summation of all Flow and Sold Data over a period between 2 and 30 days This is the best view to see how your variances are trending on a day to day basis.
- To access this view, use the filter tool and select any date range greater than 1 day but less than 30 days.
Daily View
- The daily view provides a summation of all flow and sold data over a business day. This is the best view to see how the previous day preformed. The daily view lets you easily identify brands that are causing high variances. Any brand that has a variance greater than 5% should be investigated on an hourly level.
- To access this view, use the filter tool and select any one-day date range. The data will report from Open of Business to close of business.
Hourly view
- The hourly view provides a summation of all flow and sold data for a specific brand in 10-minute increments. This view lets you see almost all individual pour and corresponding sold data. This data can be used as a coaching opportunity for Bar tenders on their pour sizes as well as keeping bartenders accountable for each beer that is poured to ensure there is a corresponding sale.
- To access this view, use the filter tool and select any one-day date range. Then within the yield tracker click on any beer you would like to see hourly data for and data will drill down to hourly data. The data will report from Open of Business to close of business.
- If you would like to access individual data points for each sale and pour, utilize the export Raw data feature.
When looking at historical data, hourly is limited to a 3 month back log. Any date range selected beyond 3 months will not display hourly data
Settings
When using the Yield Tracker widget, you can adjust the settings to tweak how the data you filtered is seen.
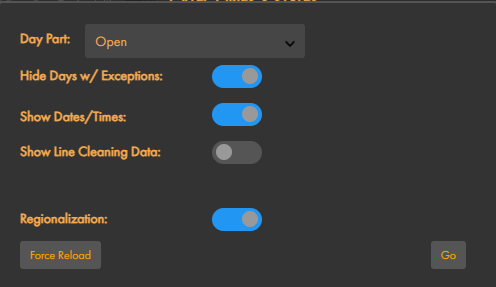
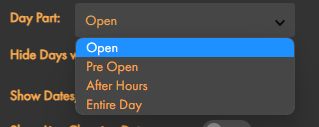
- Day Part
- Hide Days w/ Exceptions
By turning this off, the yield tracker will show potentially "bad" or what it considers irregular data. This can be caused by after-hour pouring, post-close data, equipment issues, improper placement of equipment, etc.
- Show Dates/Times
- Show Line Cleaning Data
Exporting Data
- All SmartBar reports can be exported, printed or emailed by using the widgets in the upper right corner. Data can be downloaded in a CSV, PDF or raw data format.